
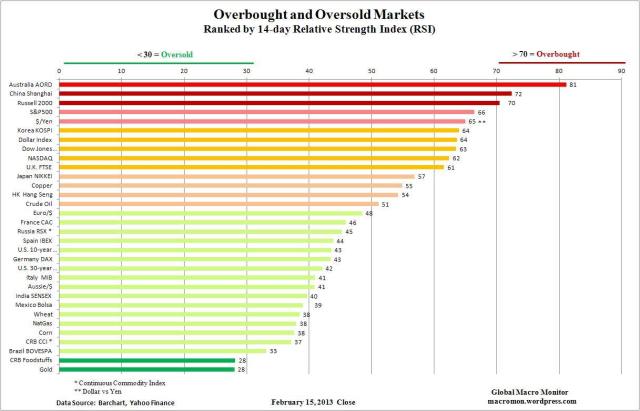
The Relative Strength Index (RSI) is a momentum oscillator that measures the speed and change of price moves. The RSI moves between zero and 100 and is considered overbought with a reading above 70 and oversold when below 30. Note the RSI can sustain an overbought (oversold) reading in a strong up (down) trend.
Click chart to enlarge.
 (click here if chart is not observable)


A reblogué ceci sur le blog a lupus…un regard hagard sur l'écocomics et ses finances…. and commented:
Add your thoughts here… (optional)
Pingback: Sunday links: shrinking from pain - Abnormal Returns | Abnormal Returns
Pingback: Gold: Time to get worried? Or greedy? – MarketWatch : INVEST WEB