
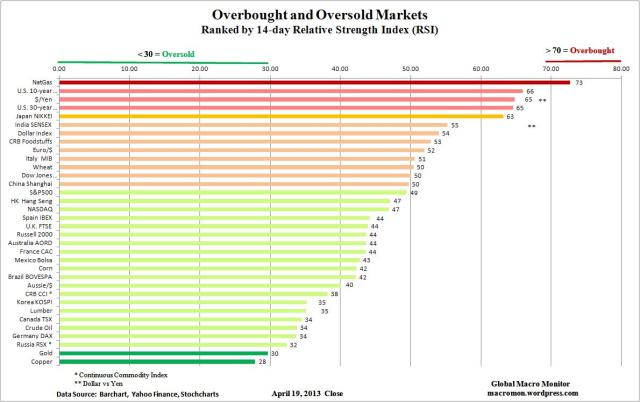
The Relative Strength Index (RSI) is a momentum oscillator that measures the speed and change of price moves. The RSI moves between zero and 100 and is considered overbought with a reading above 70 and oversold when below 30. Note the RSI can sustain an overbought (oversold) reading in a strong up (down) trend.
Click chart to enlarge.
(click here if chart is not observable)


Pingback: Sunday links: self-forming expert networks - Abnormal Returns | Abnormal Returns
Pingback: Global Trend Indicators, Overbought/Oversold | The Big Picture
Pingback: Global Trend Indicators, Overbought/Oversold - Euro News Cloud
Pingback: Global Trend Indicators, Overbought/Oversold - 旺米粑杷
Pingback: Like air out of an untied balloon... | 361 Capital361 Capital